⏱️ Approx. 6-minute read
Predict Before You React: How AI Forecasting Transforms Industrial Energy Management
October 2025
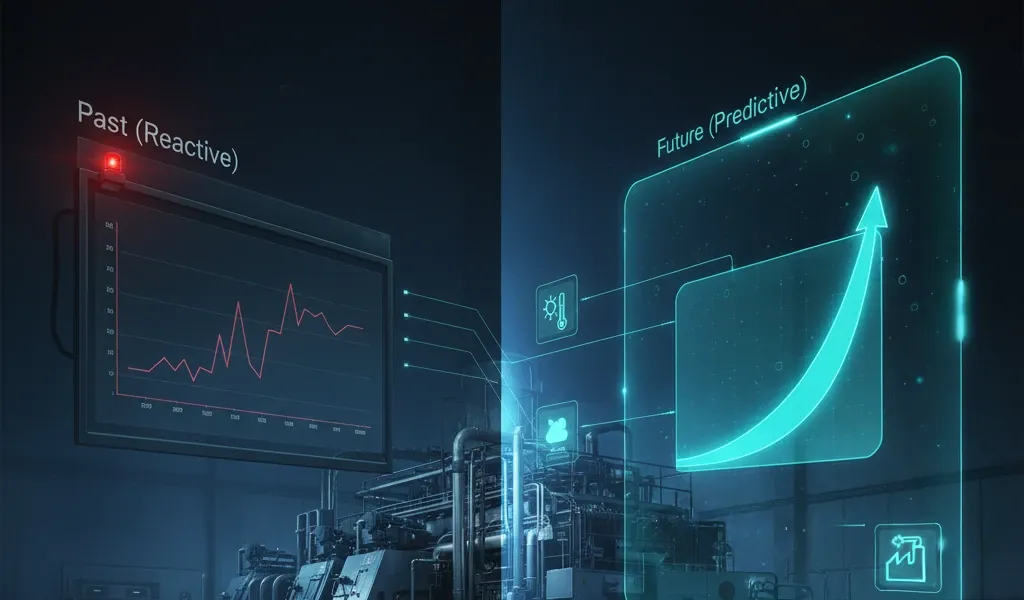
Most industrial energy teams are surrounded by charts, meters, and monthly reports—yet still find themselves reacting to yesterday’s anomalies. Real improvement begins when visibility turns into foresight. Forecasting and anomaly detection shift energy from something monitored to something managed—turning every kilowatt into an operational decision point.
This article shares field-ready practices for using predictive analytics in ISO 50001-style systems: what data matters, how models should be framed, and how predictions translate into better daily decisions.
1) What to Predict—and Why It Matters to Operations
Forecast the drivers, not just the numbers.
Under ISO 50001, relevant variables—also called drivers—are the dynamic factors
that affect energy use: production rate, material type, process temperature,
and weather conditions. If your model predicts tomorrow’s kWh and shows that
80% of the variance comes from two production drivers plus ambient temperature,
your team can act: reschedule energy-intensive orders to off-peak hours or
fine-tune process setpoints.
Detect deviations at the SEU level.
A Significant Energy User (SEU) is any process, machine, or area that consumes
a major share of energy or offers high improvement potential. Predictive
baselines quantify what “normal” looks like for each SEU—such as a compressor
station, chiller, or curing oven. When real-time data deviates beyond its
predicted range (after accounting for current drivers), the system can flag
a reasoned anomaly: “Compressed-air SEU is 14% above baseline at current
throughput.” That’s a maintenance conversation, not just an energy one.
2) The Minimum Data You Actually Need
Perfect data is rare; usable data is enough.
- Energy meters on each SEU or utility feed, at 5–15-minute intervals.
- Production and process drivers: throughput, run/idle states, product type, setpoints, material grade.
- Weather drivers: temperature and humidity—critical for HVAC, drying, and cooling loads.
- Static factors: number of shifts, area size, or installed capacity for contextual normalization.
Even partial data can build a first-pass baseline. The exercise reveals where metering gaps exist and helps plan instrumentation with purpose, not guesswork.
3) Building Models People Can Trust
Predictive tools in factories don’t need to be academic—they need to be explainable. Correlation and regression show which drivers influence energy most. Time-series forecasting projects day-ahead demand with confidence bands. Anomaly logic compares actual vs. expected SEU performance under current drivers.
Think of it like calibrating a flow meter: operators don’t care about the algorithm’s math, only that its output behaves predictably. Transparency builds confidence for engineers, and traceability satisfies ISO 50001 auditors reviewing the Energy Performance Indicators (EnPIs).
4) Predictive Use Cases That Change the Floor
a) Day-Ahead Planning
- Problem: Peak loads coincide with high tariffs.
- Predictive approach: Forecast total demand by production schedule and weather drivers.
- Result: Planners simulate “what-if” scenarios—moving heat-intensive batches to cooler hours or alternative shifts.
b) Utility Health Monitoring
- Problem: Abnormal baseloads go unnoticed until bills arrive.
- Predictive approach: Baseline kWh vs. production drivers; flag residuals above set limits.
- Result: Maintenance teams receive SEU-specific alerts with context, not raw alarms.
c) Performance Verification
- Problem: Proving improvement when production and weather vary.
- Predictive approach: Compare normalized baselines (EnB) before and after actions.
- Result: Reports show “9.8% normalized improvement at 95% confidence,” a statement both management and auditors accept.
5) Common Pitfalls—and How to Avoid Them
- Perfection paralysis: A 92% accurate model in use beats a 98% model still in testing.
- Ignoring data governance: Tag changes or sensor replacements cause drift—track and retrain regularly.
- Treating all SEUs alike: Each SEU has its own signature; modularize models.
- Black-box syndrome: Always keep a transparent baseline alongside any advanced model for cross-checking.
6) Turning Predictions into Decisions
- Natural-language queries: Operators ask, “Why is the paint booth using more energy today?” and get driver-based answers.
- Contextual alerts: “Oven Zone 3 is +9% vs. predicted; check insulation panel replaced yesterday.”
- Learning loops: The system logs operator actions and updates its baseline—showing that human input improves machine intelligence.
When people see that their insight shapes the model, adoption skyrockets.
7) Six Months Later: What Success Looks Like
- Reliable day-ahead forecasts integrated into planning.
- Fewer unexplained peaks—every deviation linked to a driver.
- Normalized performance reports that survive ISO audits.
- Active operator engagement visible in system logs.
- Verified savings clustered around controllable SEUs.
- A repeatable method for finding the next opportunity.
Reflection
Visibility without foresight keeps teams reactive. Predictive, driver-aware baselines help factories negotiate with their energy in real time. The real transformation isn’t in the math—it’s in culture. When planners, operators, and maintenance share a common view of what should happen next, energy stops being an afterthought and becomes part of operational excellence.